Automatic Screw Feeding System ROI Analysis | Automation Investment Return Calculation
| Product Name | Applicable industries |
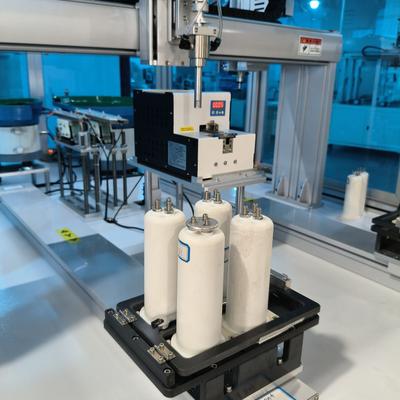
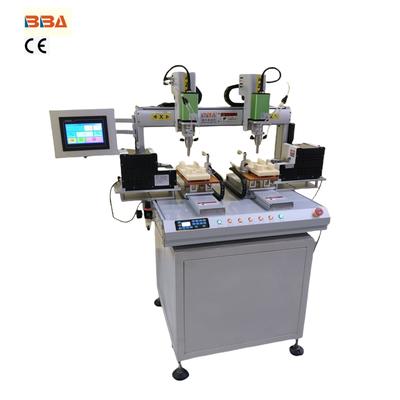
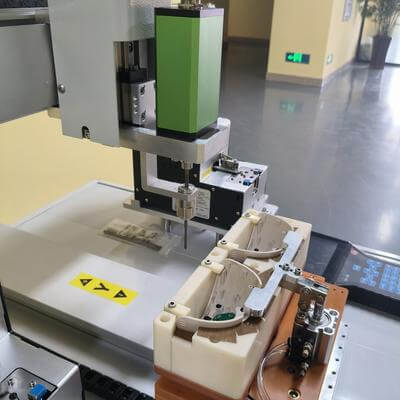
| Automatic Screw Feeder | PCB and Circuit Board Assembly (Electronics), Appliance Manufacturing, Automotive Electronics, Consumer Goods Assembly |
Measuring ROI from Automatic Screw Driving Systems
Industrial automation represents a strategic investment, and decision-makers rightly demand clear proof of value before implementing solutions like automatic screw driving systems. Accurately measuring Return on Investment (ROI) clarifies the financial impact beyond operational improvements. This analysis provides a framework for quantifying benefits while addressing implementation considerations.
What Contributes to ROI? Automatic screw driving systems drive ROI through multiple channels:
Labor Savings: These systems reduce manual assembly time significantly. Calculate this by comparing operator hours saved per unit against system operating costs. Example: If manual screwing requires 5 minutes per unit and an automated system reduces this to 1 minute at $45/hour labor cost, saving $3/unit. At 500 units/day, this saves $1,500 daily.
Defect Reduction: Consistent torque application minimizes cross-threading, stripped screws, and loose connections. Track prior rework/scrap costs versus quality improvements post-automation. If defect rates drop from 5% to 0.5% with a $50 reprocessing cost per unit, annual savings reach substantial figures at scale.
Throughput Gains: Operating continuously without breaks, these systems boost output. Measure increased units/hour multiplied by profit margin per unit. A 25% production lift directly accumulates value across shifts.
Indirect Benefits: Secondary impacts include ergonomic injury reduction (lowering workers' compensation costs), decreased training expenses for repetitive tasks, and traceability data for quality audits.
Building the ROI Calculation
Compile annual savings across categories:
Annual Savings = (Labor Savings + Defect Savings + Throughput Value) + Indirect Cost Reductions
Then calculate ROI using total implementation costs:
ROI (%) = [(Annual Savings - Operating Costs) / Total Implementation Costs] × 100
Implementation costs include hardware, integration, training, and maintenance. Production disruptions during ramp-up should be considered in the timeline.
Addressing Implementation Challenges
Initial outlay concerns can be mitigated through modular implementations – automate high-volume processes first. Integration complexity varies by facility infrastructure; validating communication protocols and mechanical fit upfront is essential. Maintenance planning should account for predictive component replacements to avoid unplanned downtime.
Long-Term Value
ROI analyses typically show payback periods under 24 months with diligent measurement. Beyond immediate gains, consistent quality improves brand reputation and customer retention. Automatic screw driving systems also create adaptable platforms for future line expansions – software updates or modular add-ons extend functionality without complete reinvestment.
Ultimately, successful automation requires treating ROI as a continuous metric. Benchmark initial performance, track dynamic variables like labor rates and defect trends, and reassess annually. When strategically implemented, these systems deliver compounding value through force precision, operational reliability, and data-enabled decision-making impossible to achieve manually.